Many employees are asked to present their data but only some of them are good at it. You might be a good data presenter but struggle when you actually get the opportunity to do so. Those who have never presented their data before will most likely be nervous.
But don’t worry. We are here to help you out. If you want to learn how to prepare for a data presentation, here are some tips that will help you shine in your next presentation.
Contents
Consider Your Audience
When you are preparing to present data infographic to an audience, the most important thing to consider is the audience itself. Understand who will be in the audience. It’s also important to consider the audience’s prior knowledge of the data you are presenting.
Consider their level of interest in the data and whether or not they possess any competing interests. If you can understand the audience’s background in the topic, you will be able to construct your presentation to their expectations.
Identify the Purpose of Your Data Presentation
Consider the needs of your audience and tailor the presentation to fit those needs. Research your topic and collect data from reliable sources. Organize the data into relevant categories and figure out how to best demonstrate the issue or trend.
Choose appropriate software to present the data. You can use PowerPoint, Excel, or even Google Slides for the presentation. Run a trial presentation and have a few practice runs. Make sure to leave enough time for questions and answers and be knowledgeable enough to back up your conclusions.
Decide How You Will Structure Your Presentation
Start by adding the key points that you want to discuss. Try to keep your points concise and to the point, as well as chronological or related. Decide the order you want to discuss each point and add transitions between slides and sections.
Once you have designed the structure, you can begin to fill in the details and organize your thoughts. Researching any new material or terms you are going to discuss, including any new vocabulary, is also important before delivering your presentation.
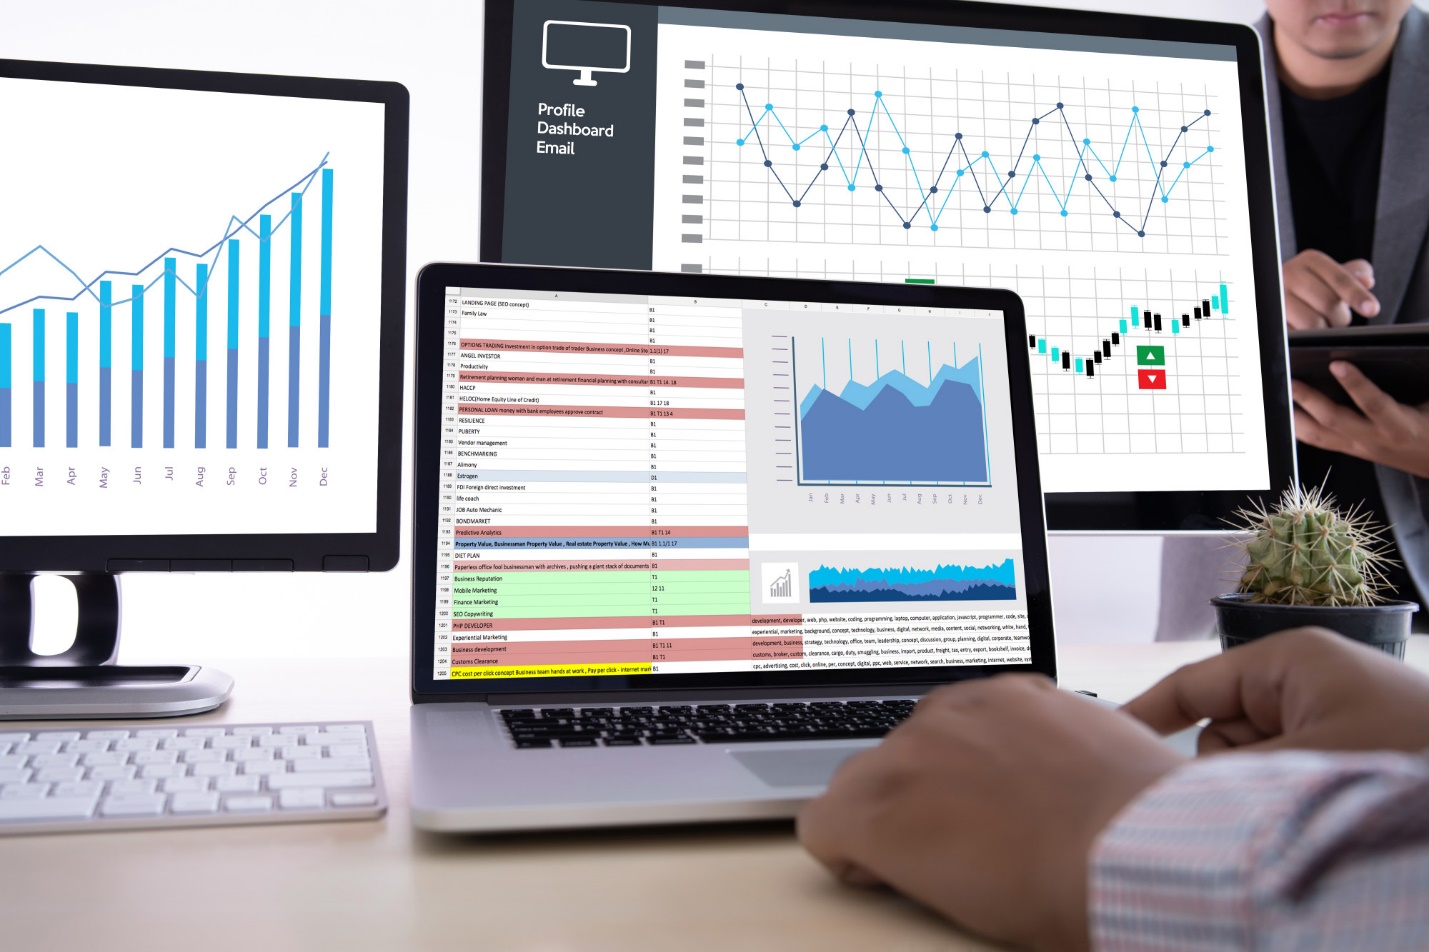
Find Meaningful and Accurate Visuals
High-quality visuals help to present ideas in a simpler format for the audience and make the presentation more impactful. A few sources to consider for data visualization can include stock photography, news publications, industry partners, and clipart galleries.
When searching for visuals for data heavy presentations, remember to make sure they are high-resolution, licensed, and relevant to the points you are wanting to present. Research online for an infographic creator with templates to make the designing of the presentation easier.
Thoroughly Practice Your Presentation
Walk through this as if it were an actual presentation to ensure you are keeping track of the time and content. Make sure to practice the presentation aloud with a timer. This will help you to craft a smooth transition between topics and make sure that the structure of the presentation is polite.
Consider using a video conferencing platform to record yourself practicing. It allows you to review and make any necessary edits.
Have a Smooth Data Presentation With Proper Preparation
Ensure the data presentation goes as smoothly as possible by planning ahead. The provision of the right tools and equipment to cover all the aspects of the data presentation, as well as careful rehearsal, will go a long way towards crafting the perfect data presentation.
Don’t forget to take the time to ensure you have everything in order for the big day. Be confident, and go present your data!
Browse our blog for more interesting reads!